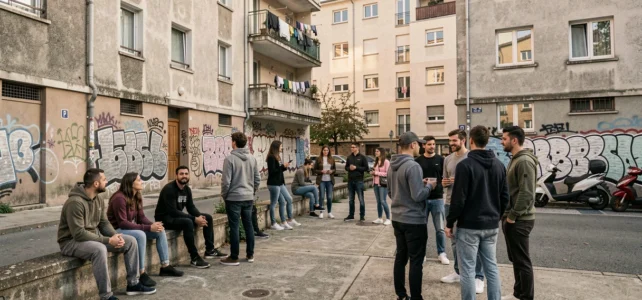
Summer 2026 put French urban neighborhoods under rare climate pressure. A heatwave lasting 23 consecutive days, which began on July 28 and officially ended on August 19 according to Météo-France, matched the record set in 1983. This exceptional duration focused attention on the most exposed urban areas, where heat does not dissipate at night and health tensions accumulate.
Urban heat islands: what neighborhood maps reveal
Departmental crime rankings or lists of sensitive urban areas say nothing about the heat experienced street by street. Recent tools are changing the game. Météo-France now offers urban heat island maps covering 47 French agglomerations, stemming from the MApUCE project. These maps allow for thermal disparities to be read at the neighborhood level, not just at the municipal level.
The Urba-Clim platform, highlighted by Clubic in August 2026, tracks temperature variations in cities in almost real-time using satellite data and ground sensors. Measurements taken in Rennes confirmed that some dense neighborhoods remain several degrees warmer than peripheral areas, even after midnight.
To discover the interactive map on Essentium, it is enough to cross-reference these thermal data with the social indicators of priority neighborhoods, whose geography was updated on January 1, 2024, by the ANCT.

Nocturnal heat in the city: the aggravating factor that averages mask
Daytime maximum temperatures attract media attention. The real marker of health risk is at night. When the thermometer does not drop below a certain threshold after sunset, the body does not recover. The nocturnal persistence of heat in the city concentrates excess mortality much more than daytime peaks.
Summer 2026 illustrated this clearly. Paris and Île-de-France found themselves at the heart of the heatwave with readings reaching 38 °C, according to La Chaîne Météo. In contrast, rural municipalities located just a few dozen kilometers away showed significant disparities as soon as night fell.
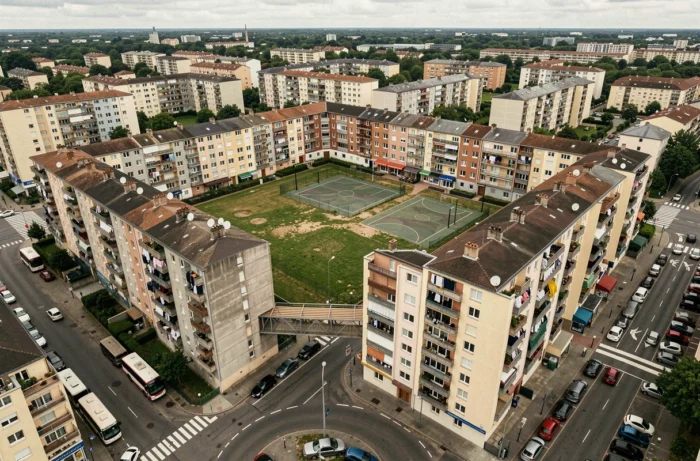
The explanation lies in the mineralization of soils. Concrete, asphalt, and glass facades store heat during the day and release it at night. The densest neighborhoods, often the priority neighborhoods of urban policy, combine poorly insulated housing, few green spaces, and high population density.
Priority neighborhoods and thermal vulnerability
The territorial reports from the ANCT, updated in August 2026, show that residents of priority neighborhoods are overexposed to several simultaneous factors:
- An old building stock or large housing estates, rarely designed for prolonged heatwave episodes, with insufficient thermal insulation
- Limited access to cooled spaces (parks, bodies of water, public air-conditioned facilities), as infrastructure is often concentrated in city centers
- A higher proportion of isolated elderly individuals and families with young children, the two populations most vulnerable to heat
The available data do not allow for a conclusion that all priority neighborhoods are heat islands. Some, located on the periphery with more vegetation, fare better than fully mineralized heritage city centers.
Current tensions in France: when heat intersects with social fragilities
The term “hot” applied to a neighborhood encompasses two distinct realities that are often confused. There is heat in the climatic sense, measurable by satellite. And there is social tension, documented by crime statistics and indicators of territorial cohesion.
Summer 2026 showed that these two dimensions geographically overlap in many agglomerations. The municipal statistical bases of crime, available on data.gouv.fr, allow for cross-referencing recorded incidents by the police and gendarmerie with thermal data.
Paris (75) appears as the department most affected in terms of the gross volume of recorded incidents, with a national total of 3,480,779 incidents recorded according to official statistics compiled by Chiffrex. Lozère (48) ranks at the opposite end of the scale. These raw figures do not take into account population density, which limits their analytical scope.
Limitations of city or department rankings
Lists of the “most dangerous cities” circulate widely online. Their methodology presents several concrete issues:
- Incidents are counted at the place of commission, not at the residence of the perpetrators or victims, which mechanically inflates the scores of employment and transport hubs
- The rate per thousand inhabitants varies significantly depending on whether the resident population or the present population (tourists, commuters) is considered, a major bias for cities like Paris or Nice
- Field reports diverge on this point: some municipalities record more complaints due to accessible police stations, which paradoxically improves their “crime score”
A raw ranking without demographic correction or consideration of the local context produces misleading results. The priority geography defined by the ANCT, with its criteria of median income and density, offers a more rigorous framework than media rankings.
Weather vigilance and neighborhood adaptation: concrete pathways
Météo-France confirmed that July 2026 is the hottest and one of the driest months ever recorded in France. Climate projections indicate that this type of episode will become more frequent in the coming decades.
Several agglomerations are experimenting with responses at the neighborhood level. The urban heat island maps of the 47 agglomerations covered by the MApUCE project now serve as a basis for local urban planning to identify areas where greening or soil de-sealing would have the most impact.
The Urba-Clim tool, which utilizes satellite data combined with ground measurements, allows for almost real-time monitoring. This type of fine mapping goes beyond the simple Red Vigilance alerts from Météo-France by offering a reading by micro-zone rather than by department.
The overlap of thermal maps and social data from priority neighborhoods remains an ongoing project. The ANCT reports updated in 2024 provide the territorial foundation, but the systematic cross-referencing between climate vulnerability and social fragility has not yet been integrated into a single public tool. This is likely where the next step of urban policy in the face of climate change will take place.